Graphs
Graphs allow to express complex data in visual form. They are very good for
quick view of the state. MyTracker can make graph from any SQL table.
Supported kind of graph: pie, bar, horizontal bar and line. It is possible to
cumulate the x-axis values. Useful for timeline (per month) graphs. For line
graphs it is possible to define one sum function. It's handy for graphs like
open/close + all issues. MyTracker allow to describe graph axis with issue field captions,
months names and 'open'/'close' strings.
The only tricky part of making graph is to write the right SQL select command.

Look at the graph definition:

The series selector is the columns in which the change of value starts a new graph series.
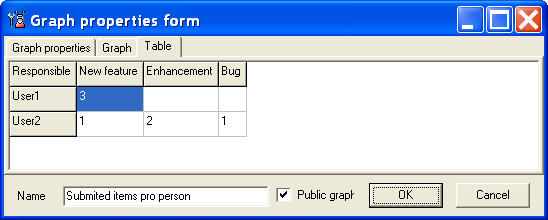
The last feature of graphing is the (cross)table.

The graph and table data can you put to clipboard and process in other application like MS Excel.

See also:
Queries
Parameters


